Tables, charts, percentages, rates and multi-step calculations.
These are original Cutline questions. They are not taken from the official UCAT ANZ question bank or an exam. The clock below gives each set 43 seconds per question, based on the published 2026 timing. The 2027 format has not yet been published.
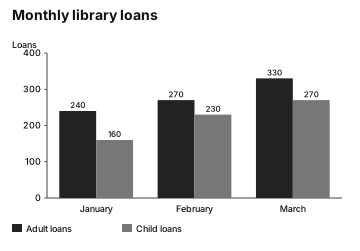
A fictional community library records loans in three months. Adult and child loans are separate counts.
march adult renewal rate: 20 %
march child renewal rate: 30 %
march open days: 20 days
The March renewal rates are the shares of loans in each group that were renewals.
Grouped bars showing adult and child loan counts in January, February and March
Question 1
What percentage of January loans were child loans?
The keyed answer is A.
January had 240 adult loans and 160 child loans, giving 400 loans in total. The child share is 160 / 400 x 100 = 40%. Option B calculates the adult share instead: 240 / 400 x 100 = 60%.
Common trap: of vs more than.
Question 2
By what percentage did adult loans increase from January to February?
The keyed answer is B.
Adult loans rose from 240 in January to 270 in February, an increase of 30 loans. Divide that increase by the original January count: 30 / 240 x 100 = 12.5%. Option E uses the whole February count, 270 / 240 x 100 = 112.5%, rather than the increase.
Common trap: wrong base.
Question 3
What percentage of all March loans were renewals, when the adult and child renewal rates are applied to their respective loan counts?
The keyed answer is C.
Apply the two renewal rates to their own groups: 330 x 0.20 = 66 adult renewals, and 270 x 0.30 = 81 child renewals. That is 147 renewals among 330 + 270 = 600 March loans, giving 147 / 600 x 100 = 24.5%. Option B's 25.0% is an unweighted average of the two rates, despite the different group sizes.
Common trap: chain step missed.
Question 4
In March, how many loans were recorded per open day, to the nearest whole loan?
The keyed answer is D.
March's 330 adult and 270 child loans total 600 loans. Divide by 20 open days: 600 loans / 20 days = 30 loans per open day. Option C omits child loans and gives 330 / 20 = 16.5, which rounds to 17 loans per day.
Common trap: chain step missed.
Set 2
02:52
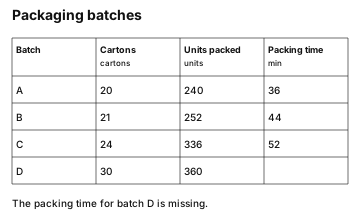
A fictional packing workshop records four batches. Batch D's packing time is missing. Packaging costs AUD 1.50 per carton, plus one AUD 8 handling fee for each batch.
total minutes: 200 min
batch count: 4 batches
fee per carton: 1.50 AUD/carton
handling fee per batch: 8 AUD/batch
The four batches took 200 minutes in total. The packaging charge is AUD 1.50 per carton, plus one AUD 8 handling fee per batch.
Four batches with carton counts, packed unit counts and packing times; batch D has no recorded time.
Question 1
How many units were packed per carton in batch B?
The keyed answer is E.
Use the unit count and carton count from the same batch: 252 / 21 = 12 units per carton. Option A uses batch A's carton count, giving 12.6 before rounding.
Common trap: chain step missed.
Question 2
What was the mean number of units packed per batch?
The keyed answer is A.
A mean across batches uses all four unit counts and divides their sum by four. The total is 1,188 units, which gives 297 units per batch. Option B finds the median instead.
Common trap: wrong statistic.
Question 3
What was the median packing time across the four batches?
The keyed answer is B.
First subtract the three recorded times from 200 minutes to find batch D's 68 minutes. Ordered times are 36, 44, 52 and 68 minutes, so average the two middle times. Option E gives the missing time rather than the median.
Common trap: wrong statistic.
Question 4
What is the packaging charge for batch D?
The keyed answer is C.
Multiply 30 cartons by AUD 1.50, then add the handling fee once for the batch. The carton charge is AUD 45, so the total is AUD 53. Option A leaves out the handling fee.
Common trap: modifier skipped.
Set 3
02:52
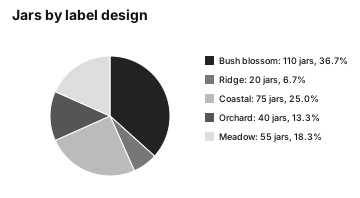
A fictional honey packer labels one batch of jars. The pie chart shows the number of jars with each label design.
honey grams per jar: 250 g/jar
grams per kilogram: 1000 g/kg
labels per jar: 2 labels/jar
rejected share: 0.2 1
labels per sheet: 25 labels/sheet
Each jar contains 250 g of honey.
There are 1000 g in 1 kg.
Each jar needs two labels. Each sheet prints 25 labels, and 20% of printed labels are rejected.
Pie chart of five label designs, with jar counts for each design
Question 1
What percentage of the jars have a coastal label, to the nearest whole percent?
The keyed answer is E.
Add the five design counts to get 300 jars. Coastal accounts for 75 / 300 x 100 = 25% of them. Option A uses the 225 jars outside coastal as the denominator instead of the full batch.
Common trap: wrong base.
Question 2
What is the combined mass of honey in the bush blossom and coastal jars, in kilograms?
The keyed answer is A.
Bush blossom and coastal account for 110 + 75 = 185 jars. At 250 g per jar, that is 46,250 g, or 46.25 kg after dividing by 1000. Option D uses meadow's 55 jars in place of coastal's 75.
Common trap: chain step missed.
Question 3
How many sheets' worth of labels must be printed to leave two usable labels for each coastal and meadow jar, if 20% of printed labels are rejected?
The keyed answer is B.
The 130 coastal and meadow jars need 260 usable labels. Since 80% of printed labels remain usable, divide 260 by 0.8 to get 325 labels to print. At 25 labels per sheet, this is 13 sheets' worth. Option C adds 20% to 260, but the rejected 20% is a share of the printed total.
Common trap: modifier skipped.
Question 4
What is the median of the five jar counts, one for each label design?
The keyed answer is C.
The five jar counts in ascending order are 20, 40, 55, 75 and 110. The middle count is 55 jars, option C. Option A finds the mean instead: the total of 300 divided by five is 60.
Common trap: wrong statistic.
Estimate or exact trainer
Choose your approach before you answer.
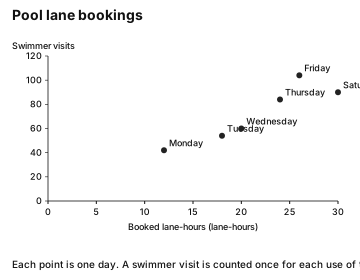
A fictional community pool records booked lane-hours and swimmer visits on six days.
Six labelled days plotted by booked lane-hours and swimmer visits
Estimate or calculate?
How many swimmer visits were there per booked lane-hour on Wednesday?
The keyed answer is B.
You chose to before answering.
Wednesday's point shows 60 swimmer visits and 20 booked lane-hours. Divide 60 by 20 to get 3.0 visits per lane-hour, option B. Option A uses Thursday's point instead.
A fictional community pool records booked lane-hours and swimmer visits on six days.
Six labelled days plotted by booked lane-hours and swimmer visits
Estimate or calculate?
Across Thursday and Friday combined, how many swimmer visits were there per booked lane-hour, to 2 decimal places?
The keyed answer is C.
You chose to before answering.
Thursday and Friday have 84 + 104 = 188 visits and 24 + 26 = 50 booked lane-hours. Divide the combined totals: 188 / 50 = 3.76 visits per lane-hour, option C. Option B averages the two daily rates equally instead of pooling the visits and lane-hours.
A fictional community pool records booked lane-hours and swimmer visits on six days.
Six labelled days plotted by booked lane-hours and swimmer visits
Estimate or calculate?
For the three days with the most booked lane-hours, what was the mean of their separate daily visits per booked lane-hour, to 2 decimal places?
The keyed answer is D.
You chose to before answering.
The three highest booked lane-hour values are 24, 26 and 30, on Thursday, Friday and Saturday. Their separate rates are 84 / 24 = 3.5, 104 / 26 = 4 and 90 / 30 = 3. The mean is (3.5 + 4 + 3) / 3 = 3.50 visits per lane-hour, option D. Option A pools the visits and lane-hours, which weights the days by their bookings.
A fictional community pool records booked lane-hours and swimmer visits on six days.
Six labelled days plotted by booked lane-hours and swimmer visits
Estimate or calculate?
What was the median number of booked lane-hours across the six days, to 1 decimal place?
The keyed answer is E.
You chose to before answering.
The ordered lane-hour values are 12, 18, 20, 24, 26 and 30. With six values, average the middle two: (20 + 24) / 2 = 22.0 lane-hours, option E. Option C calculates the mean instead of the median.