

New treatment halves your risk. It is one of the most reliable sentences in health reporting and one of the least informative, because it is equally true of both of these.
In the first, something that would have happened to two people in a million now happens to one. In the second, something that would have happened to forty people in a hundred now happens to twenty. Both of those are a halving. One is a rounding error in your life and the other is the difference between a normal decade and a terrible one.
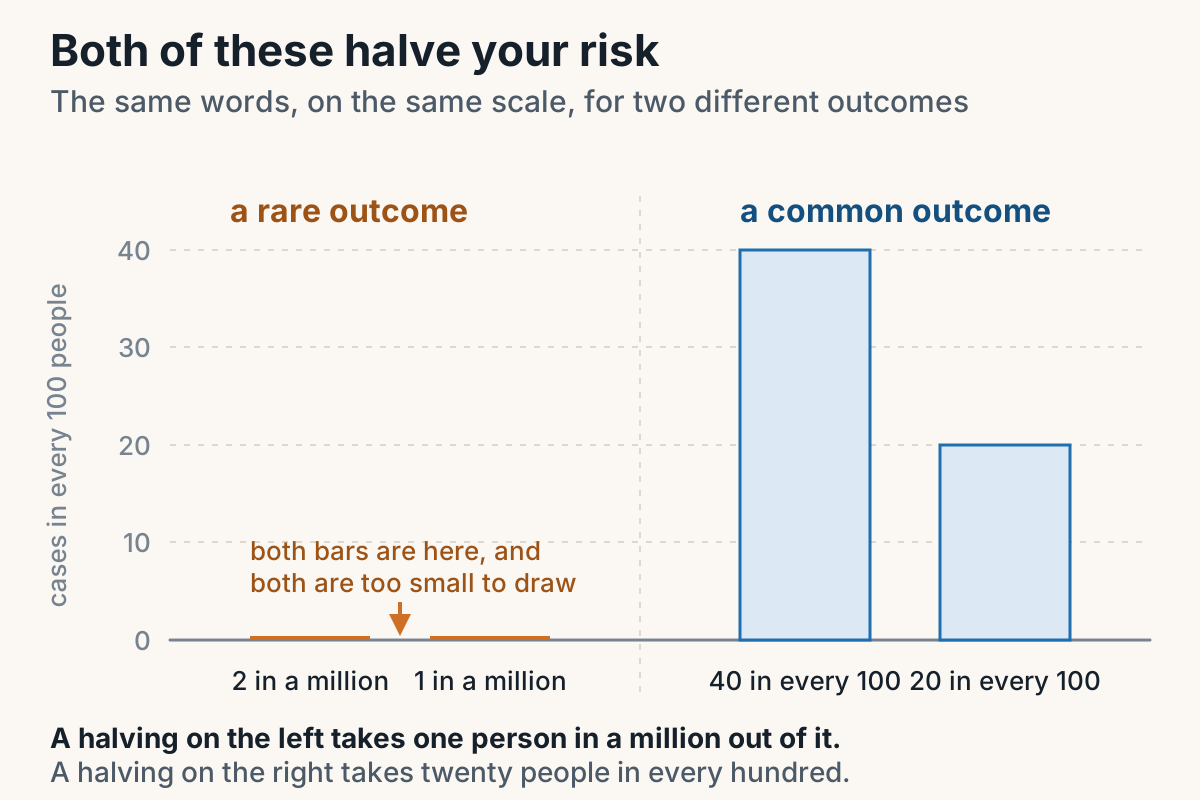
The word halves carries no information about which of those you are looking at. That is not a quirk of English. It is the problem itself, and it has a shape you can learn to recognise in about five minutes.
There are two numbers, and only one of them gets printed
When researchers compare two groups, one exposed to something and one not, there are two honest ways to report the gap between them.
You can divide. How many times as likely was the exposed group to end up with the outcome? That is a multiplier, and its technical name is the relative risk. Twice as likely, half as likely, one and a half times as likely.
Or you can subtract. How many extra people, out of a hundred or out of a thousand, ended up with the outcome because of the exposure? That is a head count, and its name is the risk difference.
The multiplier is the one that reaches the public, for a simple reason. It is usually the bigger-sounding number, and it does not oblige the writer to tell you what the risk was to begin with. Doubles your risk is a complete sentence. Two extra cases per hundred thousand people over ten years is not something anybody wants in a headline, and it is the one that tells you whether to care.
The comparison that settles it
The clearest demonstration comes from the long study of British doctors and smoking, and it points in the opposite direction to intuition.
For lung cancer, smoking multiplied the risk by 10.5. For heart attack, it multiplied it by 1.3. Read only the multipliers and lung cancer is the story, while heart disease looks like a footnote.
Now count people instead. Smoking produced about 3.1 extra lung cancers per thousand people, and about 4.8 extra heart attacks per thousand. The weaker association did more damage, because heart attacks were far commoner to begin with.
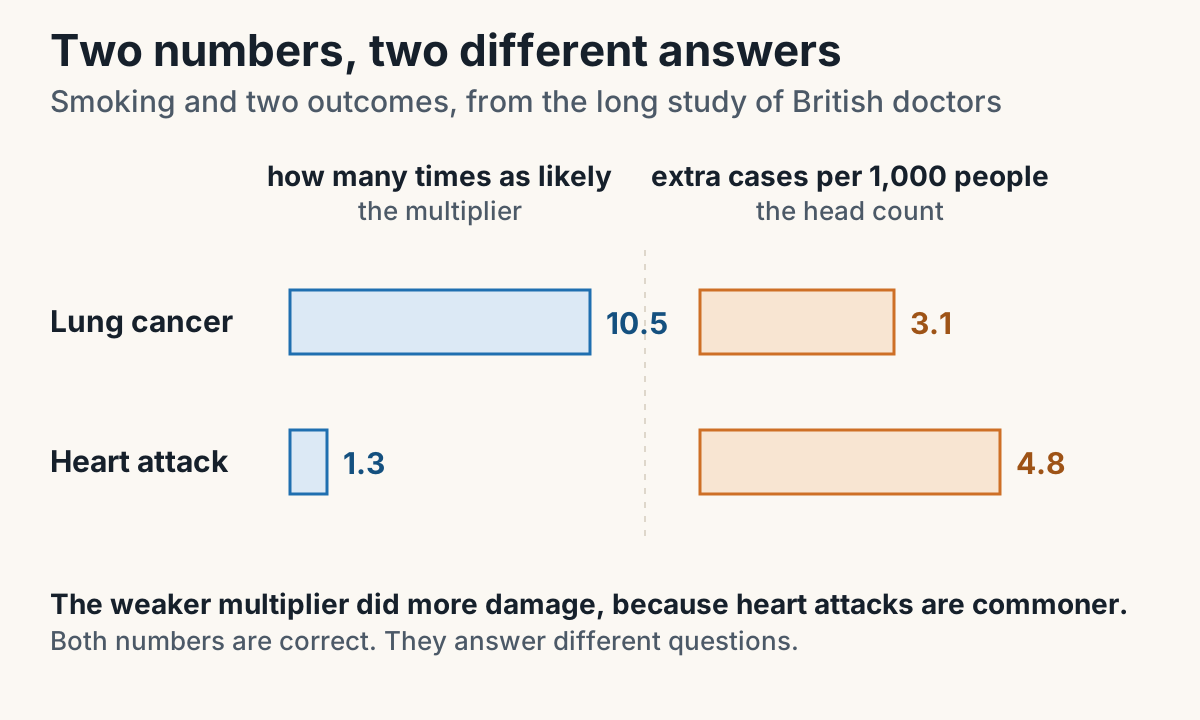
Neither number is wrong. They answer different questions. The multiplier asks how tightly the exposure and the outcome are bound together, which is a question about cause. The head count asks how much harm the exposure is actually doing, which is a question about where to put the money. A health department that read only the first column would chase lung cancer and leave the bigger toll exactly where it was.
Compared with whom
A multiplier means nothing on its own, because it is always a comparison, and the other half of the comparison is frequently missing from the article. Twice as likely as whom? As people who never drink at all, or as people who drink moderately? Those are different claims, and they produce different numbers out of the very same data.
The same fact can also be stated from either end. If one group is more likely to develop something, the other group is correspondingly less likely, and both sentences are true. Which group goes on top of the division decides which number you get, so a study that names its groups carelessly can look like it found the reverse of what it found.
There is one landmark worth keeping. Because the multiplier is a division, no difference at all comes out as 1, with harm above it and protection below. Because the head count is a subtraction, no difference comes out as 0, with extra cases above it and fewer cases below.
The third number, and why it exists
Sometimes you will meet a third one, the odds ratio, and it is there because of a limitation rather than a preference.
To work out a risk you have to know what share of a real population ended up with the outcome. For a rare disease that is impractical, so researchers do something clever and slightly deforming. They go and collect people who already have the disease, then recruit a comparison group who do not, usually several of them for every patient.
The moment they do that, the room stops resembling the world. If a disease affects a handful of people in a large population, and the study population is half patients, then any share you calculate inside that study is a number somebody chose when they decided how many people to invite. Recruit twice as many healthy comparisons and the share moves, while nothing whatsoever has changed about the disease.
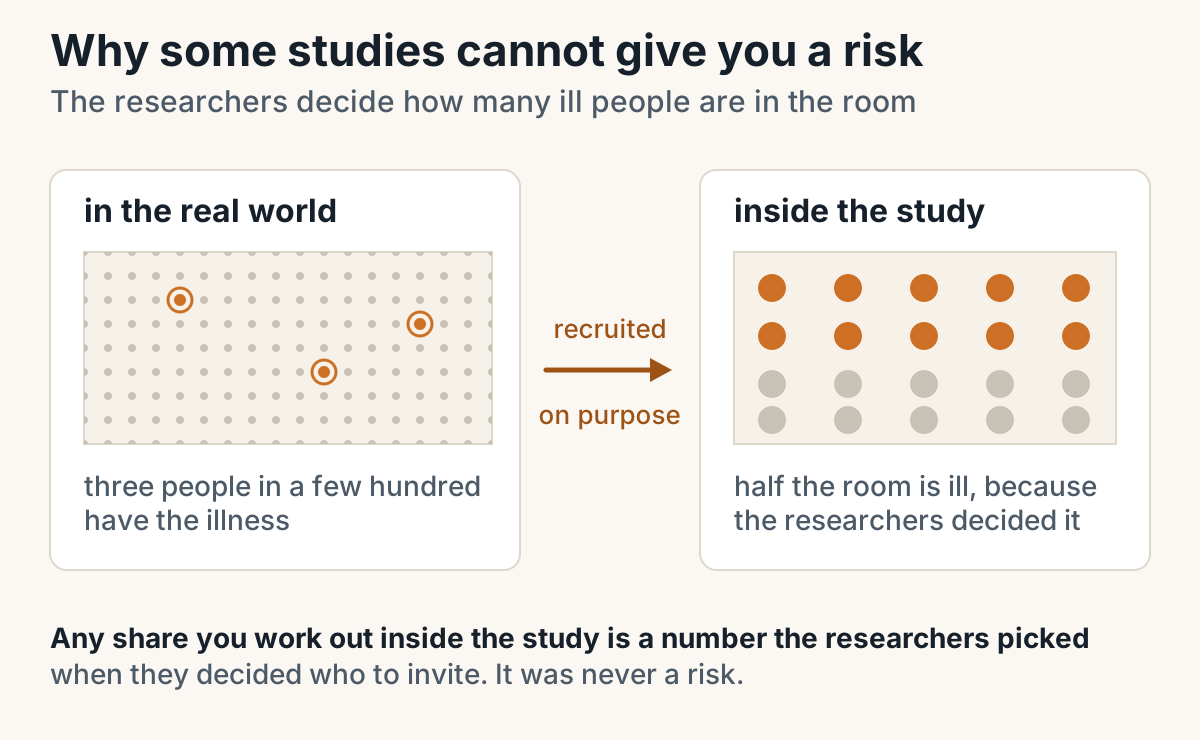
The odds ratio is the one quantity that survives this. It compares how much more likely the ill group were to have the exposure behind them, and it stays put however many comparison people get recruited. When the outcome is rare, which it usually is or the study would have been built another way, it lands close enough to a relative risk to be read the same way.
What to ask a headline
- How many times as likely, and compared with whom. A multiplier without its comparison group is not a finding, it is half of one.
- Out of how many people. A doubling of something vanishingly rare is still vanishingly rare, and a small rise in something common is a great many people.
- Over how long. Two extra cases per hundred over six months and two extra per hundred over ten years are not the same claim, and the period is the part most often dropped.
None of this needs arithmetic. It needs you to notice which of the two numbers you have been handed, and then go looking for the other one. The absolute number is almost always available and almost never printed, and once you start checking, a surprising share of alarming health stories turn out to be about a risk that was small before and is now slightly smaller.
If you are sitting POPH192, the same distinction runs through the whole measures of association section, and Cutline's POPH192 questions ask for it as a full sentence, which is the part that quietly costs people marks.