

A supplement halves your risk of a disease. It is on the bottle, it is in the press release, and it might well be true.
The question worth asking is not how much it halves. It is how they found out.
There is a whole category of study that cannot produce a risk at all, and it happens to be the one most often used for claims of this shape. If the researchers went and found people who already had the disease and asked them what they used to take, no risk comes out of that. Something that looks like a risk does, and the two are not interchangeable. Telling them apart is worth more than any of the arithmetic that follows.
The five ways of finding out
There are only a handful of ways to study whether something is associated with a health outcome, and each one is a different bargain. You give something up in order to get something.
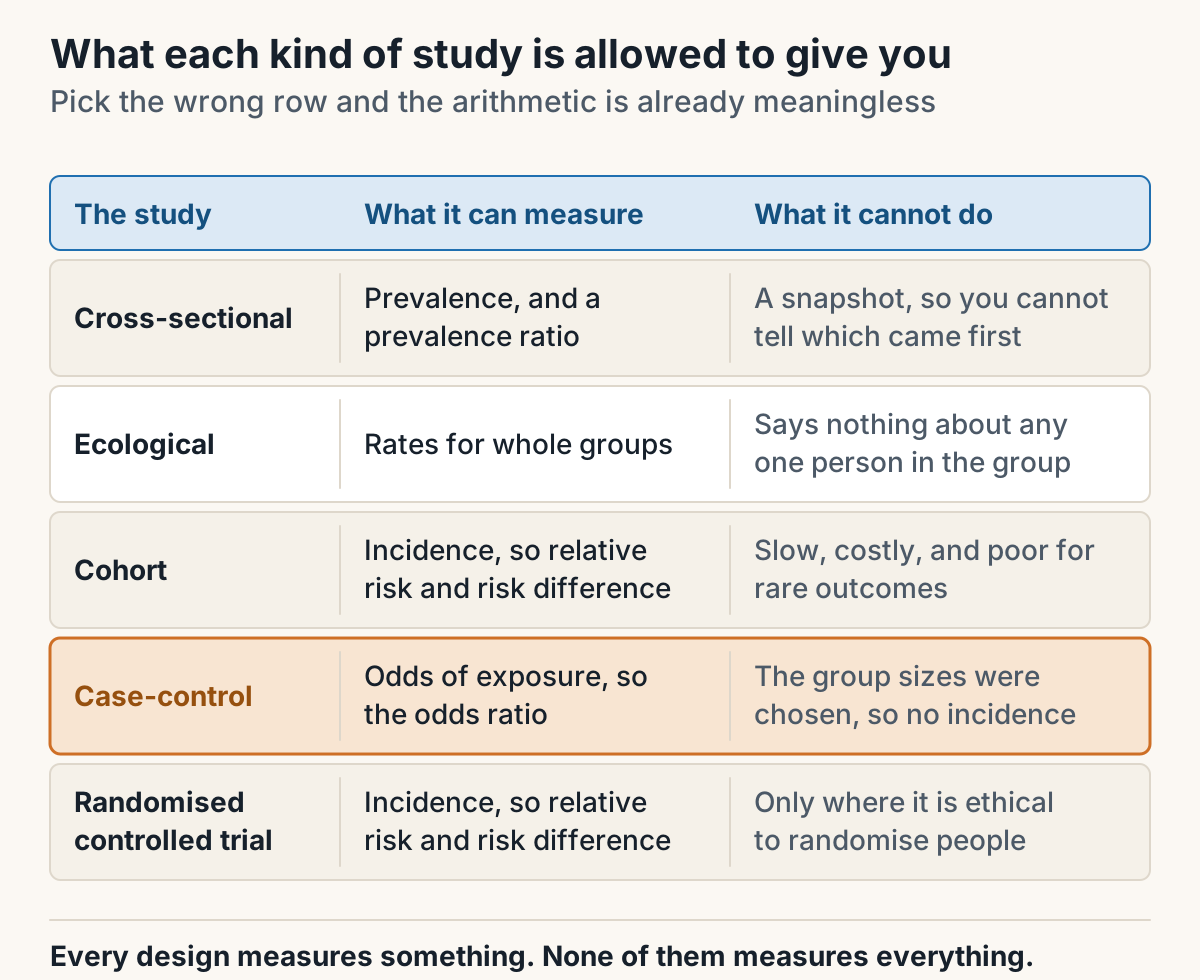
The cheapest is to take a snapshot. Ask a lot of people at one moment what they have and what they do, and you learn how common something is right now. What you cannot learn is which came first, because you only looked once. Knee pain and carrying extra weight turn up together in a snapshot, and the snapshot cannot tell you which of them arrived first.
Next you can compare whole populations rather than people. Countries with more of this tend to have more of that. It is cheap, the data is usually lying around already, and the trap is famous enough to have its own name. An association between groups says nothing about any individual inside them, and reasoning as though it does is the ecological fallacy.
Then you can follow people forward. Start with a group who are free of the outcome, note who is exposed to what, wait, and count who develops it. That gives you genuine risk, because you watched it happen, and it is why following people forward is the design that can produce a relative risk. The costs are time, money, and the fact that if the outcome is rare you will be waiting a very long time to see enough of it.
Which is what case-control studies are for. Instead of waiting, you collect people who already have the disease, collect a comparison group who do not, and ask both about the past. It is fast, and it works for rare outcomes. The price is the thing everybody forgets.
Who fixed the numbers
In a study that follows people forward, the researchers decide how many exposed and unexposed people to recruit, and then the world decides how many of them develop the disease. In a case-control study it is the other way round. The researchers decide how many people with the disease and how many without, and the world decides how many of them had been exposed.
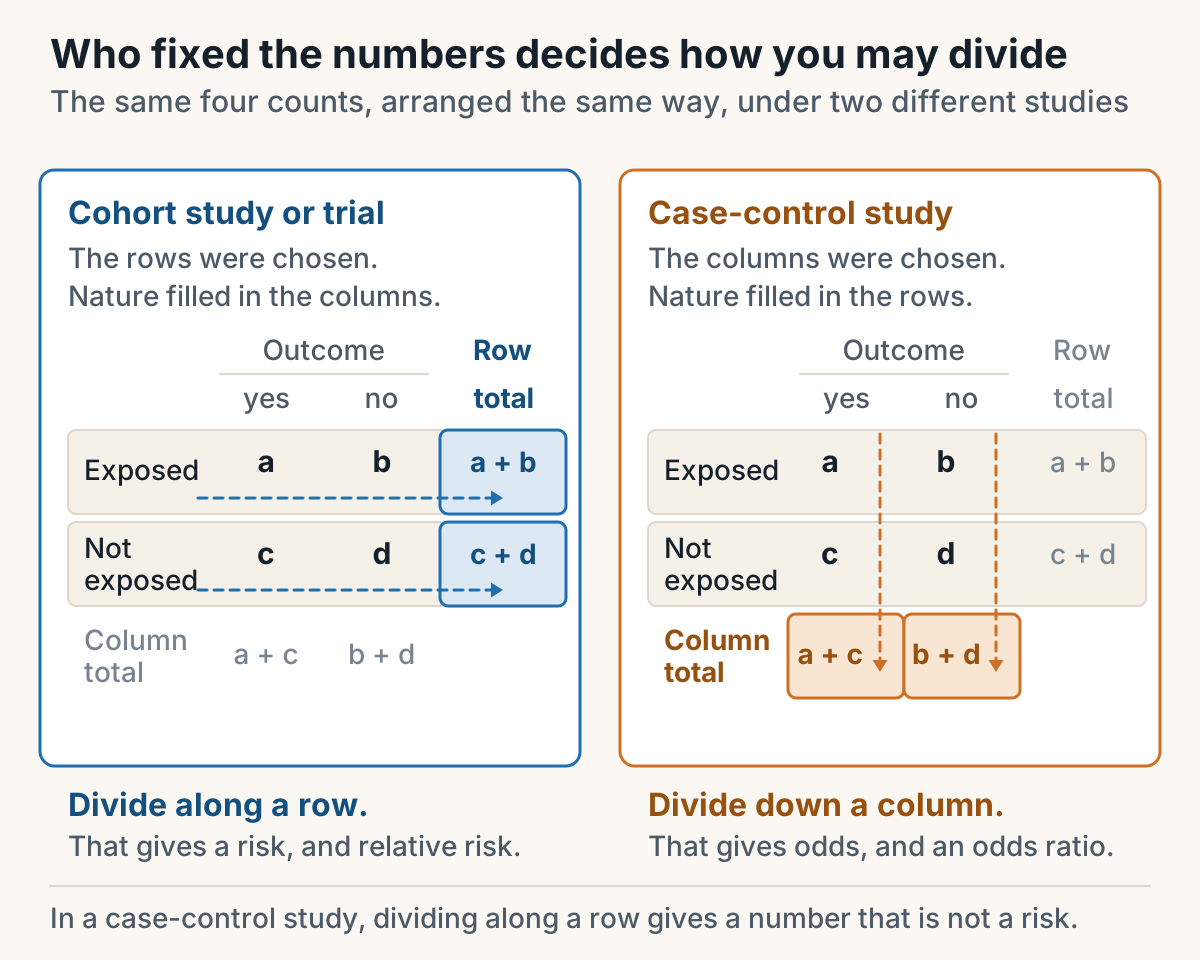
That is the whole thing. The proportion of people with the disease in a case-control study is not a fact about anyone except the person who designed the recruitment. Had they taken four comparison people per case instead of one, that proportion would have changed and nothing about the world would have. So you cannot divide across the rows, which is what a risk is. You can only compare down the columns, which is odds, and the ratio of those two is the odds ratio.
An odds ratio is still worth having. For an uncommon disease it behaves much like a relative risk, and first-year courses ask you to interpret it the same way. It simply did not come from watching anybody's risk.
Then, and only then, the arithmetic
Which brings us back to the supplement. Suppose the study was a good one, people were followed forward, and the finding is real. Two people in every thousand developed the disease without it, and one in every thousand with it.
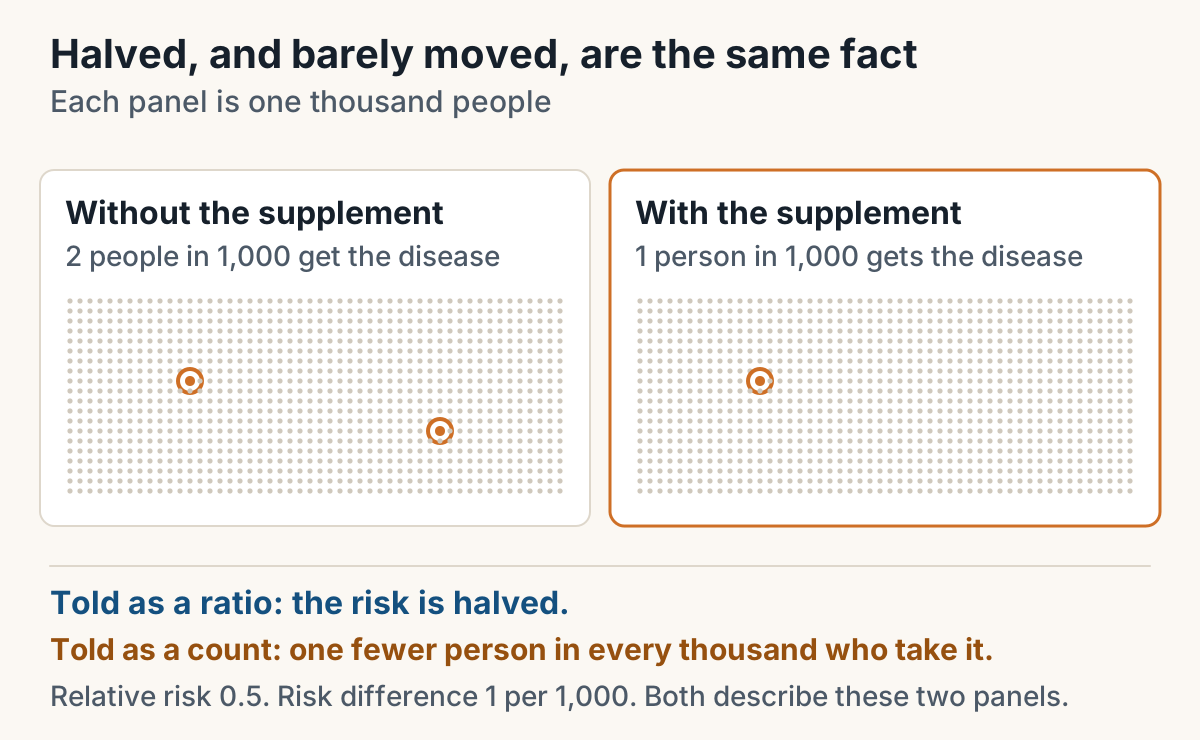
Halved is true. One fewer person per thousand is also true. They are the same two numbers reported two ways, and only one of them ever makes the headline. Whenever you meet a risk that has been halved or doubled, the follow-up question is what it was halved from, because a ratio deliberately hides the size of the thing it is a ratio of.
The sentence is most of the answer
The last place marks and arguments go missing is in the reporting. A number on its own says nothing. A measure of this kind needs a sentence with three parts, which are who was compared with whom, in that order, and over what stretch of time.
Exposed people were 1.67 times as likely to develop the outcome compared with unexposed people is an answer. The number 1.67 on its own is not, and 0.6 is the same calculation with the comparison group on top, which is the commonest way to do all the hard work and still lose the mark. If a ratio lands on the wrong side of 1, check which group you put on top before you check anything else.
Units carry the same weight. Anything reported per 100 person-years can only exist if people were followed and their time at risk was added up, so a survey run on a single day cannot produce one. Anything reported as being at the time of the study has thrown away the time, which was the only thing making it a rate in the first place.
What to keep on one page
Keep the formulas themselves somewhere you can see at a glance, on a single handwritten sheet, and stop spending revision time on them. They are the part that is genuinely easy to look up and genuinely hard to misapply once you have named the study.
The step before them is the one worth practising, because it is the one the questions are really testing, and it is the one that stays useful long after the exam. Every time somebody tells you a number about health, the first question is what kind of study it came from, and the second is who chose the denominators.
Figures have a set of traps of their own, which are in how to read an epidemiology graph without being fooled, and the rest of the run-up to the test is in how to study for Progress Test 2.
If you want the repetitions, there are POPH192 questions on Cutline with worked answers.